• Skip to primary navigation
  • Skip to main content

Obliterate.co.za

Website specialists

  • Home
  • About Us
  • Contact Us
  • Block Examples
  • Landing Page
  • Pricing Page
  • Show Search
Hide Search
You are here: Home / Archives for pumpkinslayer

pumpkinslayer

How a Support System Works

pumpkinslayer · October 1, 2014 · Leave a Comment

Customer Support
Customer Support

A support system is a way of handling all the incoming communications to your business or school.

Traditionally, electronic communication would have been email. Now it can also consist of Facebook messages, Twitter messages and messages from a wide range of sources.

Managing all of those messages can quickly become a mess.

Email is usually the first choice, but in a traditional setup it has major limitations.

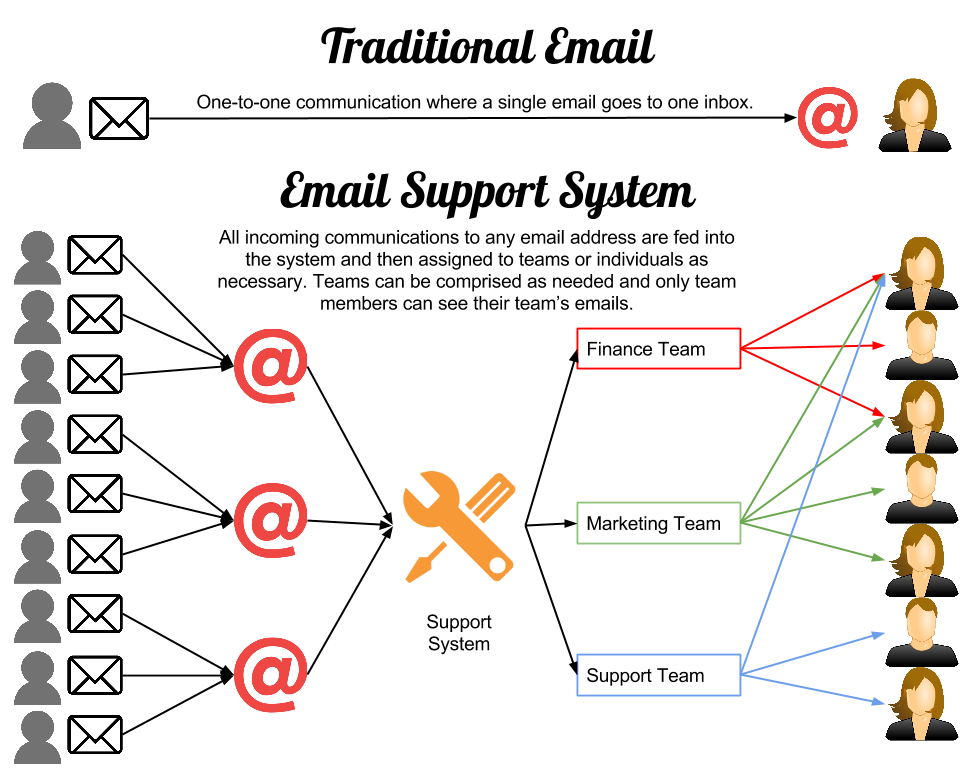
Email was only really intended for one-to-one communication or sometimes one-to-many. The actual usage now is much more complicated.

In order to manage all those messages a system needs to be put in place to manage those messages.

Organization

Within an organization there are the individuals ranging from the owner, boss, CEO and members of management through to every other person who handles something within the company.

Those individuals are usually broken in teams. These could be whole departments, or smaller subdivisions of those departments. Essentially teams of people who deal with specific issues or who share a similar roles and responsibilities.

The Process

Here’s the process for group emails (eg. support@yourcompany.com and billing@yourcompany.com ):

  1. Email flows in.
  2. The email is sorted automatically according to the email address.
  3. Email is stored in the system and allocated to a team.
  4. Team members check the incoming messages in a pseudo-inbox.
  5. Messages are answered or tagged for the attention of another team member.
  6. Answers to messages are automatically sent to the original sender.
  7. The original sender can mark their message as solved or followup if they need further response.

And that’s it in a nutshell.

The diagram below shows the general idea.

support-system-overview


Site Stats Explained

pumpkinslayer · February 28, 2014 ·

Site stats track information about the people who come to your site. What people were searching for, what they looked at and other details are recorded for later analysis. Understanding what people are looking for and whether they found it on your site will give you clarity on where you should focus your content creation efforts.

These statistics are provided by Google Analytics and presented on your dashboard for convenience.

Here, I give a basic outline of the stats provided, what they mean, and what you can do with that information. This article gives a bird’s eye view on things. Further articles will explain how we can dig further into the data to better understand our current visitors.

If you don’t have any visitors as yet, don’t fret, get some ideas from the Google keyword tool first and then come back to these stats after a month.

Overview

Dashboard Overview
Dashboard Overview

The overview on the dashboard give an outline of visits for the most recent 30 days.

  • Pageviews – how many pages have been displayed to visitors (a single visitor can visit more than one page)
  • Visits – how many people have visited your site
  • Unique visitors – how many people have visited your site (excludes repeat visits)

Click the “See All Stats” button to see the full view of the statistics

Statistics Date Selection

Date Selection
Date Selection

There are three choices for time view.

  • Last month – displays statistics from the past 30 days
  • Last 3 months – displays statistics from the last 90 days
  • Last year – displays statistics from the past year

For sites that target time-sensitive keywords, and topics that quickly fall out of fashion, then the shorter timespan can give a better overview of things as they are at the moment.

More evergreen sites that provide information, the yearly stats can give a much better picture of what people have been looking for over time. You can see how much your content has met their needs or missed the target. Adjust from there.

Visitor Stats

Visitors
Visitors

The visitors view is much like the view on the main dashboard with a few extra bits of info.

The main graph shows the visits

  • Pageviews – how many pages were shown regardless of who they were shown to
  • Visitors – how many people visited, return visits counted
  • Unique visitors – how many people visited, return visitors not counted again

Extra stats

  • Visits – total visits for the time time period
  • Unique visitors – total for the time period
  • Pageviews – total for time period
  • Pages/Visit – number of pages (on average) viewed by a visitor to your site
  • Bounce Rate – how many visitors left from the same page that they entered (ie. didn’t view any other pages on your site)
  • Avg. Visit Dur. – how long a single visit to your site was
  • New Visits – what percent were visitors who had never come to your site before

Country Stats

Countries
Countries

This provides a breakdown of where your visitors come from. This information can be checked against what you were expecting. If you’re receiving a lot of traffic from somewhere you didn’t expect you could start tailoring your content to that audience. You could also adjust your content to something more local to attract more visitors from a specific location.

Content Stats

Page Content
Page Content

A listing of your top pages and posts.

See which are getting a lot of traffic and which ones aren’t doing so well. Use these as a reference when crafting new content. These give a good idea of what is popular on your site. A post series on a popular topic could boost traffic or even focus on less popular content if it’s an important focus of your website.

Referrer Stats

Referrers
Referrers

The “Top Searches” box shows which keywords were used to find your site. This means that your site showed up in the search results when someone typed in those words.

The “Top Referrals” box shows where visitors came from. Mostly it shows which search engines.

That’s the big picture. From there a certain amount of logic and creativity can be used to understand what possible actions to take next, but that’s for a future post.

How Google Adwords Works

pumpkinslayer · December 12, 2013 · Leave a Comment

Google AdWords is Google’s advertising network. It allows you (the advertiser) to show your ads across Google and all the sites that belong to the Google Adsense publishers network.

AdWords is a pay-per-click program, so you only pay when someone actually clicks on your link. If noone clicks then you don’t get any visitors and you don’t pay anything. It is also a bidding based network, so popular word or phrases cost more because more advertisers are bidding.

The Google Adwords administration area allows you control over advertising spending, costs per click and tracking of the performance of your advertising.

Advertising Locations

Google AdWords allows you to advertise across their advertising network which includes:

  • Google
  • YouTube
  • Google Mobile
  • Publishers using Google AdSense

On Google

AdWords on Google
AdWords on Google

On Google, someone searches for “yoga”, they then see the results page for that search term. The paid results are shown in the red block, the natural (free) results, appear below them.

On Mobile Devices

AdWords on Mobile Devices

Much the same applies for mobile devices. The paid results appear above the free results. They have a slightly yellow background to separate them from the natural results.

On Other Sites

AdWords on Other Sites

If you select to advertise through the search network as well as on the Google search pages your ads will appear on other sites that are part of the Google AdSense program.

Your ads will appear on sites that are similar in nature to the keywords you are bidding for and similar to the content of the page where people clicking on your ad will go.

e.g. Your ad for “Yoga mats” might appear on a site about yoga because it closely matches the content of the site. People who are there are likely to be interested in your offering. However, your “yoga mats” ad will be less likely to be seen on sites that focus on golf because the content doesn’t match. It’s not this simple and golfers might actually be interested in yoga mats, and the particular visitor might have just been to a yoga site, so you ad could still appear on the golf site. This is all part of Google’s secret sauce.

Ad Position

If you as an advertiser want to appear in the paid results, you need to bid for a position. Within the Google AdWords dashboard you set a maximum bid for “yoga”. The maximum bid varies, depending on the popularity of the search term. You can set the maximum as high as you like, too high and you’ll blow your budget very fast, too low and you might appear very seldom in the results.

Factors determining your costs and advertising position:

  • your site quality
  • your maximum bid
  • your competitors (queue)

Your site quality

Google wants quality. When you make a bid they analyze the page you will send people to through your ad. If Google determines your site (in particular the page they’ll be sent to) to be of high quality, and the content very relevant to someone clicking through to it, that’s good for you. This quality reduces your bid, and increases your exposure, because Google wants to give the best quality in search.

Your maximum bid

The more you’re willing to pay for a position, the more exposure and views you’ll get. However, quality is more important, and even with obscenely high bids you could lose out to an advertiser who has a high quality site that Google sees as more relevant.

Your competitors

Every advertiser will get a turn to show up in the results. After the factors above, after some time you will still show. It’s best to try skip the line by making sure your site’s quality is top notch.

Campaign Monitoring

AdWords Campaign Monitoring

The Google AdWords dashboard keeps detailed statistics on the performance of all your advertising campaigns. These campaigns can also be tied in with a Google Analytics account to not only track the performance of the ads, but link those ads to specific outcomes.

For example, you can track how many people click on your ad, how many of them actually stay on the page you send them to and then how many of them fill out a contact form for more information. From there you can tweak the ad, tweak the content of the landing page and maximize your ROI for your advertising budget.

Costs

Your costs are determined by:

  • cost-per-click (CPC)
  • maximum bid
  • daily budget.

Cost-per-Click

CPC is how much a single click costs on average. This is determined by Google. Popular phrases cost more. You will get an idea of what the average is beforehand, but yours could be more or less than the estimated cost.

Maximum Bid

Maximum bid is the maximum you are willing to pay for a single click for a phrase. Note that you can have many phrases, all with differing maximums.

Daily Budget

Daily maximum means your ads will stop showing when your daily budget has been exhausted.

eg.
Your daily budget: R10
Your maximum cost-per-click: R0.50
Estimated average cost-per-click: R0.40
Approximate number of clicks per day: 25

You can click here to see the official AdWords page on Google.

Facebook Page Guide

pumpkinslayer · April 15, 2013 · Leave a Comment

A “Facebook Page” is any non-personal page on Facebook. A Facebook Page can be used for businesses, groups or organizations. A Facebook Page can even be used for celebrities who want to separate their personal and professional accounts. Facebook pages have a lot of similarities with personal Facebook accounts in how they are managed. This document runs through the basics of using a Facebook Page.

These include:

  • posting messages
  • posting photos
  • adding photo albums
  • changing the profile and cover photos
  • and others..

Note: The presentation can be viewed below (use the arrows to navigate, and the “four arrow” button to make it fullscreen). Alternatively, download it in PDF format below.


download here
Click here to download the PDF


View this presentation online at Google Docs

Hit the ground running with a minimalist look. Learn More

Obliterate.co.za

Copyright © 2025 · An Obliterate.co.za Production · Log in

We use cookies to ensure that we give you the best experience on our website. If you continue to use this site we will assume that you are happy with it.Accept