Site stats track information about the people who come to your site. What people were searching for, what they looked at and other details are recorded for later analysis. Understanding what people are looking for and whether they found it on your site will give you clarity on where you should focus your content creation efforts.
These statistics are provided by Google Analytics and presented on your dashboard for convenience.
Here, I give a basic outline of the stats provided, what they mean, and what you can do with that information. This article gives a bird’s eye view on things. Further articles will explain how we can dig further into the data to better understand our current visitors.
If you don’t have any visitors as yet, don’t fret, get some ideas from the Google keyword tool first and then come back to these stats after a month.
Overview
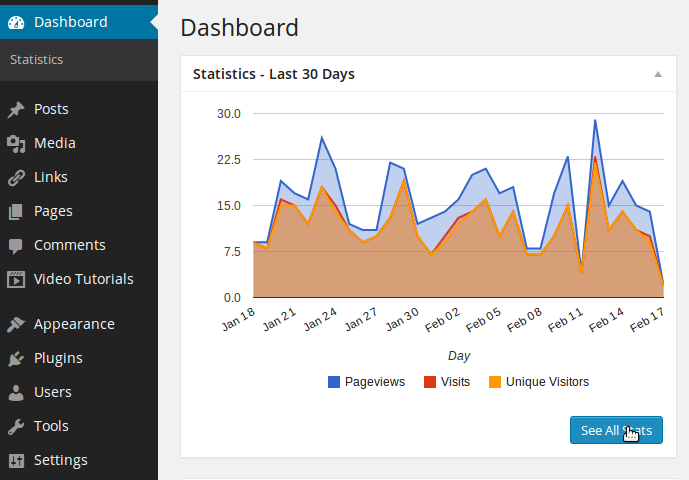
The overview on the dashboard give an outline of visits for the most recent 30 days.
- Pageviews – how many pages have been displayed to visitors (a single visitor can visit more than one page)
- Visits – how many people have visited your site
- Unique visitors – how many people have visited your site (excludes repeat visits)
Click the “See All Stats” button to see the full view of the statistics
Statistics Date Selection

There are three choices for time view.
- Last month – displays statistics from the past 30 days
- Last 3 months – displays statistics from the last 90 days
- Last year – displays statistics from the past year
For sites that target time-sensitive keywords, and topics that quickly fall out of fashion, then the shorter timespan can give a better overview of things as they are at the moment.
More evergreen sites that provide information, the yearly stats can give a much better picture of what people have been looking for over time. You can see how much your content has met their needs or missed the target. Adjust from there.
Visitor Stats
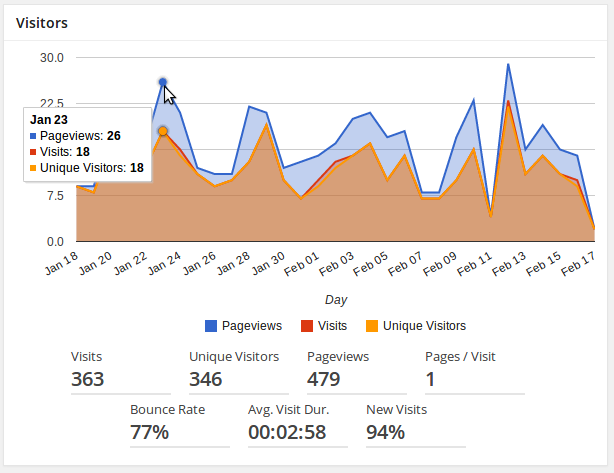
The visitors view is much like the view on the main dashboard with a few extra bits of info.
The main graph shows the visits
- Pageviews – how many pages were shown regardless of who they were shown to
- Visitors – how many people visited, return visits counted
- Unique visitors – how many people visited, return visitors not counted again
Extra stats
- Visits – total visits for the time time period
- Unique visitors – total for the time period
- Pageviews – total for time period
- Pages/Visit – number of pages (on average) viewed by a visitor to your site
- Bounce Rate – how many visitors left from the same page that they entered (ie. didn’t view any other pages on your site)
- Avg. Visit Dur. – how long a single visit to your site was
- New Visits – what percent were visitors who had never come to your site before
Country Stats
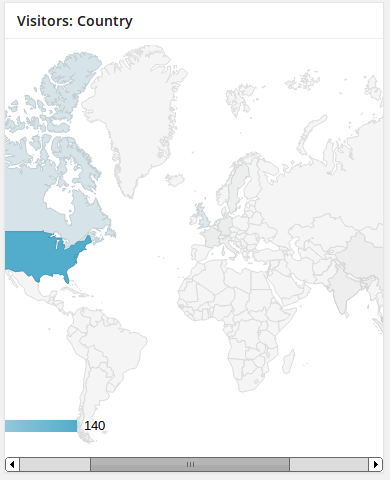
This provides a breakdown of where your visitors come from. This information can be checked against what you were expecting. If you’re receiving a lot of traffic from somewhere you didn’t expect you could start tailoring your content to that audience. You could also adjust your content to something more local to attract more visitors from a specific location.
Content Stats
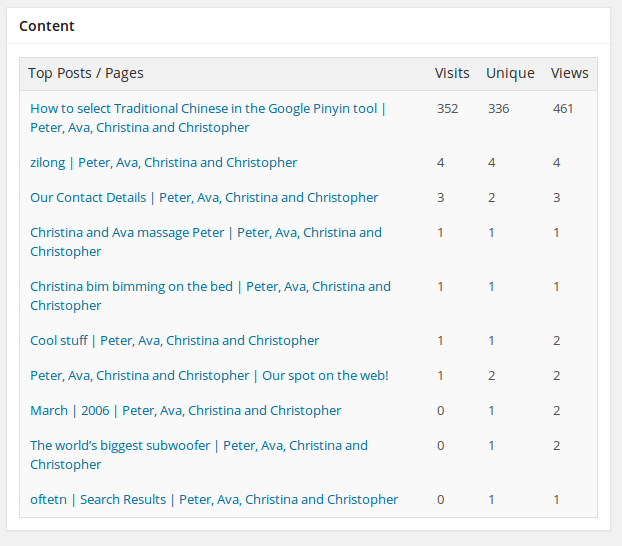
A listing of your top pages and posts.
See which are getting a lot of traffic and which ones aren’t doing so well. Use these as a reference when crafting new content. These give a good idea of what is popular on your site. A post series on a popular topic could boost traffic or even focus on less popular content if it’s an important focus of your website.
Referrer Stats
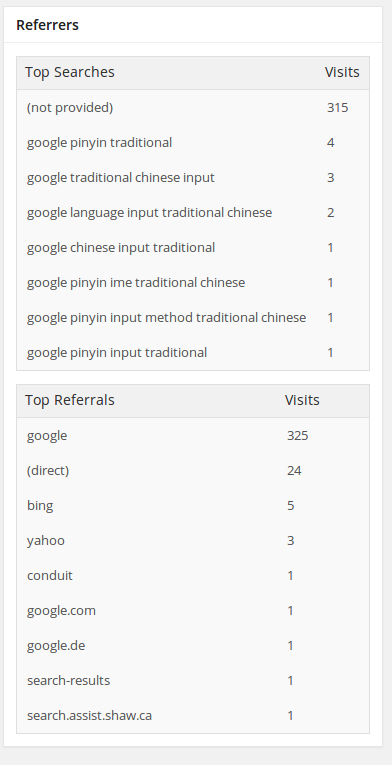
The “Top Searches” box shows which keywords were used to find your site. This means that your site showed up in the search results when someone typed in those words.
The “Top Referrals” box shows where visitors came from. Mostly it shows which search engines.
That’s the big picture. From there a certain amount of logic and creativity can be used to understand what possible actions to take next, but that’s for a future post.